Crash analysis for cities.
ICBC crash narratives become collision diagrams, a report and a workbook your engineers can act on.
- Rear end
- Side impact
- Side swipe, same direction
- Side swipe, opposite direction
- Head on
- Single vehicle, pedestrian, cyclist
- Fatal
- Injury
- Property damage only
What you receive
Every engagement ends with the same four deliverables, covering every intersection in scope. The first one we delivered, for a Metro Vancouver municipality, covered 1,331 crashes at 35 intersections from 2013 to 2022.
- The report
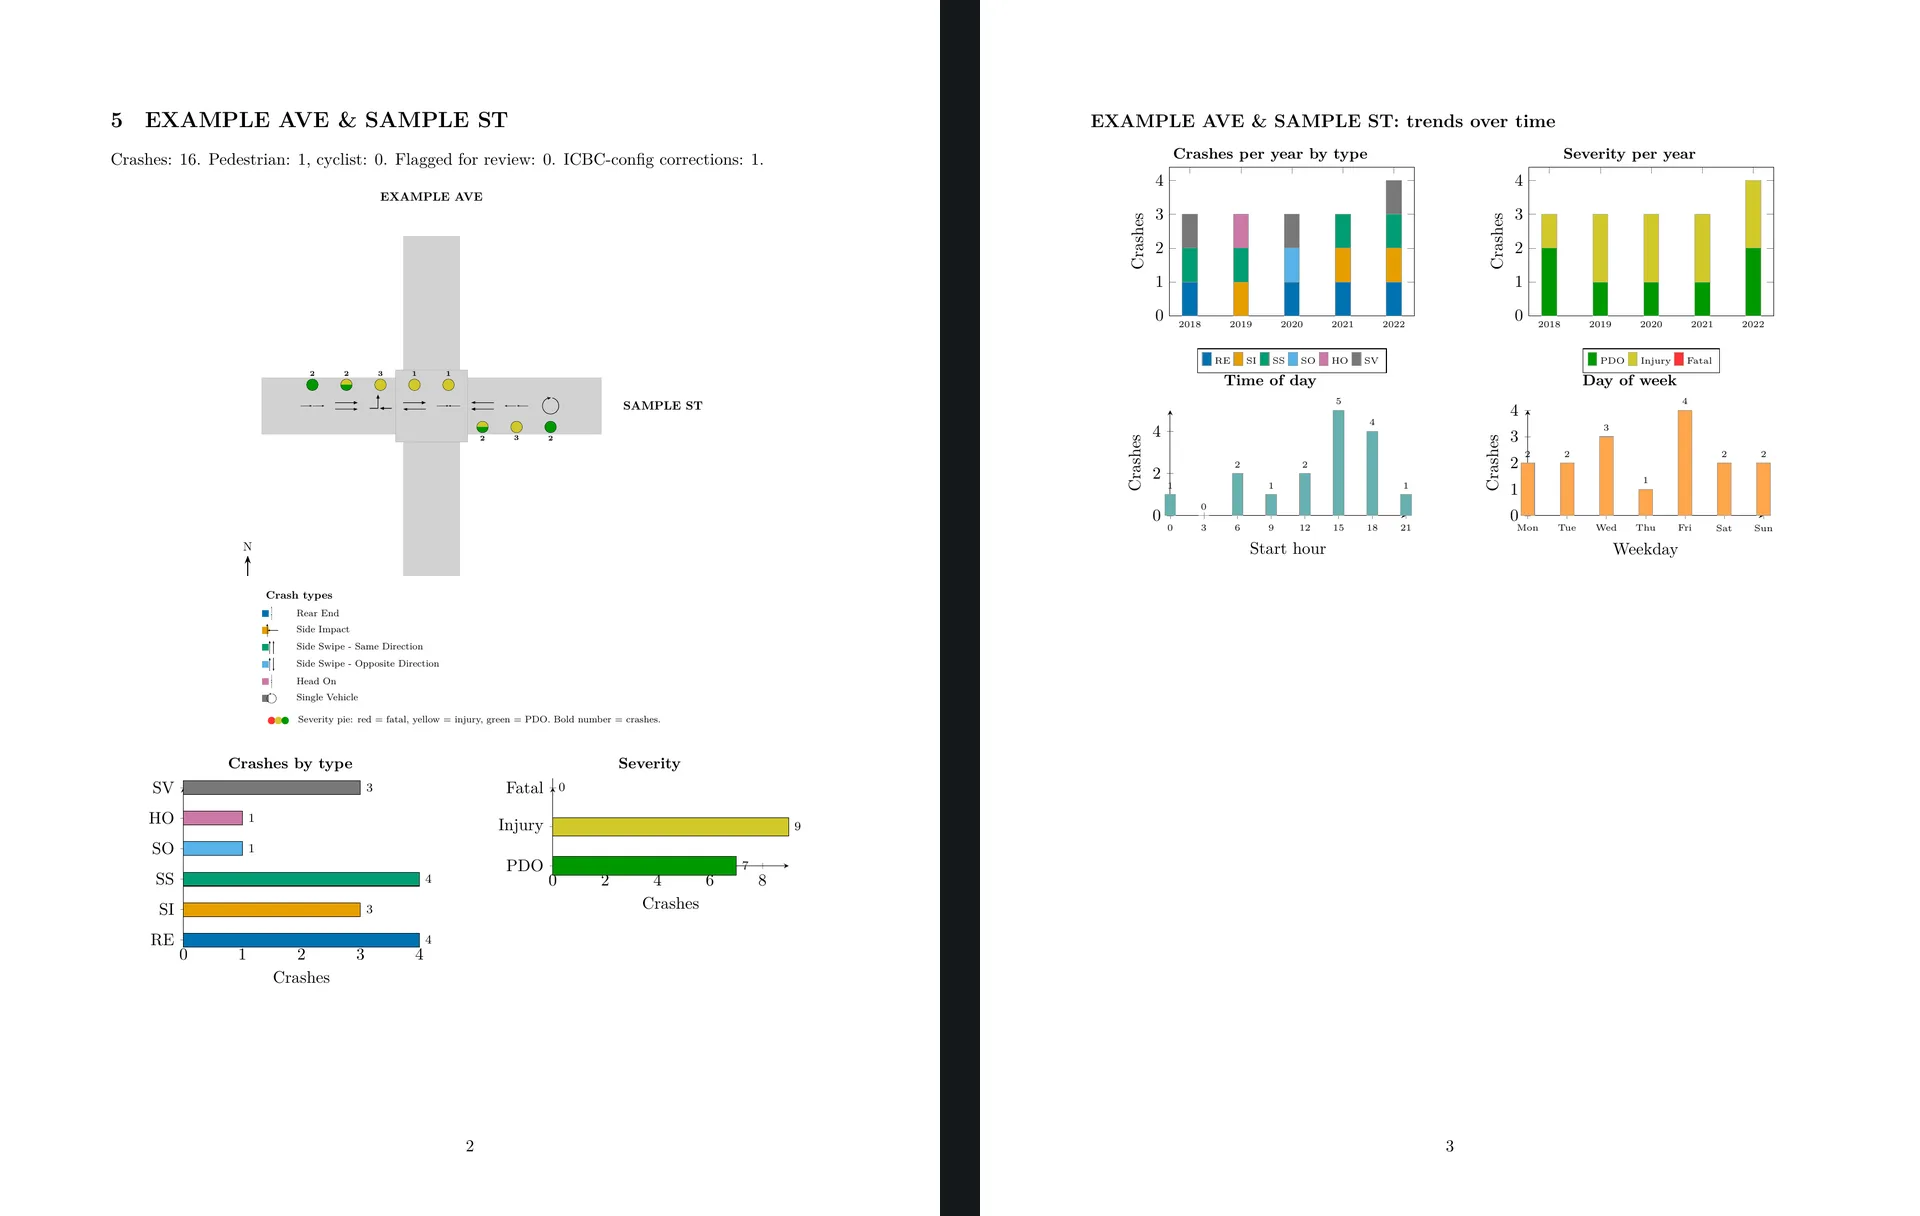
- A typeset PDF, 98 pages in that first engagement. Executive summary, a city-wide map and a ranking table with trend arrows, a methodology note, then two pages per intersection. The first carries the collision diagram with crash type and severity charts, the second time of day, day of week and severity by year.
- The workbook
- An Excel file with three sheets. One has totals per intersection, one has crash configuration by year, and one has a row for every crash with its approach directions, movements, configuration and pedestrian and cyclist flags. The report summarises, and the workbook lets your staff recount.
- The diagrams
- One top-down collision diagram per intersection, the kind shown above. Each crash is a drawn arrow for its movement, grouped by leg, with a pie showing how many were property damage, injury or fatal.
- The review page
- One HTML file that opens in any browser, with no server and no login. It lists every crash the pipeline was unsure of. Your engineer changes a call, downloads a corrections file and sends it back. We rebuild the report from the corrected data.
How it is produced
Six stages, run in order. Every result is stored with its source, so a run can stop and resume without losing work, and any answer can be traced back to the text it came from.
- Ingest1,331 narratives from 35 intersections, loaded from ICBC's own exports.
- CleanEvery narrative cleaned into one consistent form.
- ClassifyOur own fine-tuned model, run on our hardware.
- ValidateEvery answer checked against the intersection's geometry.
- ReviewSends 10 of the 15 holdout misses to an engineer.
- Report35 collision diagrams, 478 crash glyphs, 98 pages.
The narratives arrive as claims-handler shorthand, like V1 N/B lt on adv grn, V2 S/B thru, hit V1 pass side. Cleaning puts it into one consistent form. Our model, fine-tuned for this shorthand, reads the cleaned text and returns each vehicle's approach and movement, the crash configuration and any pedestrian or cyclist. Checks against the intersection's geometry then catch answers that cannot be right.
Accuracy and its limits
We measured the pipeline against hand-checked labels. Before any tuning began, 300 cases were sealed. Nobody inspected them, nothing was tuned on them, and they were read only to decide whether to continue. On that holdout the pipeline chose the correct crash configuration for 285 of 300, or 95.0%. The 300 cases we did tune on scored 94.7%, so the sealed set came out slightly higher, a sign the tuning did not overfit. Pedestrian and cyclist flags scored 100% in the final measurement.
The full direction code, every approach and turn for every vehicle, matches the hand-checked label 72.7% of the time. Some of that gap is the model and some is the label. When a narrative gives no direction, or two drivers contradict each other, no reader can be sure.
The human labels had errors of their own. Of 1,341 rows in the city's hand-checked QC sheet, the model disagreed on 527, and each disagreement was checked against the narrative. In 99 the narrative contradicts the human label, 30 of them with the wrong crash configuration, and 10 more incidents had been entered twice with conflicting labels. The human review had passed all of them. We fixed them from the narrative's own words before scoring, so the model is measured against the corrected labels, not the original sheet. The model in service today classifies with much higher accuracy than that human process.
A crash marked needs-review is one the pipeline will not vouch for. That happens when a direction is ambiguous, when the stated turn disagrees with the geometry, or when the model is not confident in its answer. Those crashes go on the review page. Of the 15 holdout errors, 10 were flagged this way. Nine of the 15 were side impacts read as same-direction sideswipes, where the narrative mentions the point of impact only in passing.
The work classifies crashes and shows where they cluster. It does not normalise by traffic volume, so there are no AADT-based crash rates. It does not run before-and-after studies. It does not design countermeasures. Those stay with your engineers, and the report gives them a place to start.
What did not work
Tuning added 6.0 points on the holdout, and every point came from fixing the deterministic checks around the model. Those checks had been throwing correct answers away, and we found the problems by auditing past results, not by running new experiments.
Every change aimed at the model itself lost ground, and none fixed a single case. The model's mistakes were systematic, the same wrong answer every time, which is a job for the checks around it and for the engineer's review, not for another attempt at the model.
Data handling
ICBC's terms of use forbid republishing its crash data, so we don't. Raw exports and row-level results go to you and nowhere else. The diagram on this page and every figure we show publicly come from a synthetic intersection with invented crashes.
Narratives can carry personal information such as names and licence numbers. We handle it under British Columbia's Personal Information Protection Act. It is used for your engagement only, kept no longer than the Statement of Work allows, and returned or deleted at the end. The report shows counts, charts and diagrams, not narratives.
Every stage, classification included, runs on our own hardware in Metro Vancouver. The model is our own, fine-tuned for this work, so narratives are never sent to an outside AI service and never leave our office. If your policy needs a specific arrangement, we settle it in the Statement of Work before any data moves.
How to engage
Every engagement starts with a Statement of Work that names the intersections, the years and the deliverables. The fee is fixed and scales with the number of intersections, and the quote states it before work begins.
You supply the ICBC exports. We classify, build the draft report and send it with the review page. Your staff mark any calls they disagree with, and one corrections round is included. We apply the changes and issue the final report and workbook. The timeline goes into the Statement of Work and depends mostly on how many intersections are in scope and how quickly the review comes back.